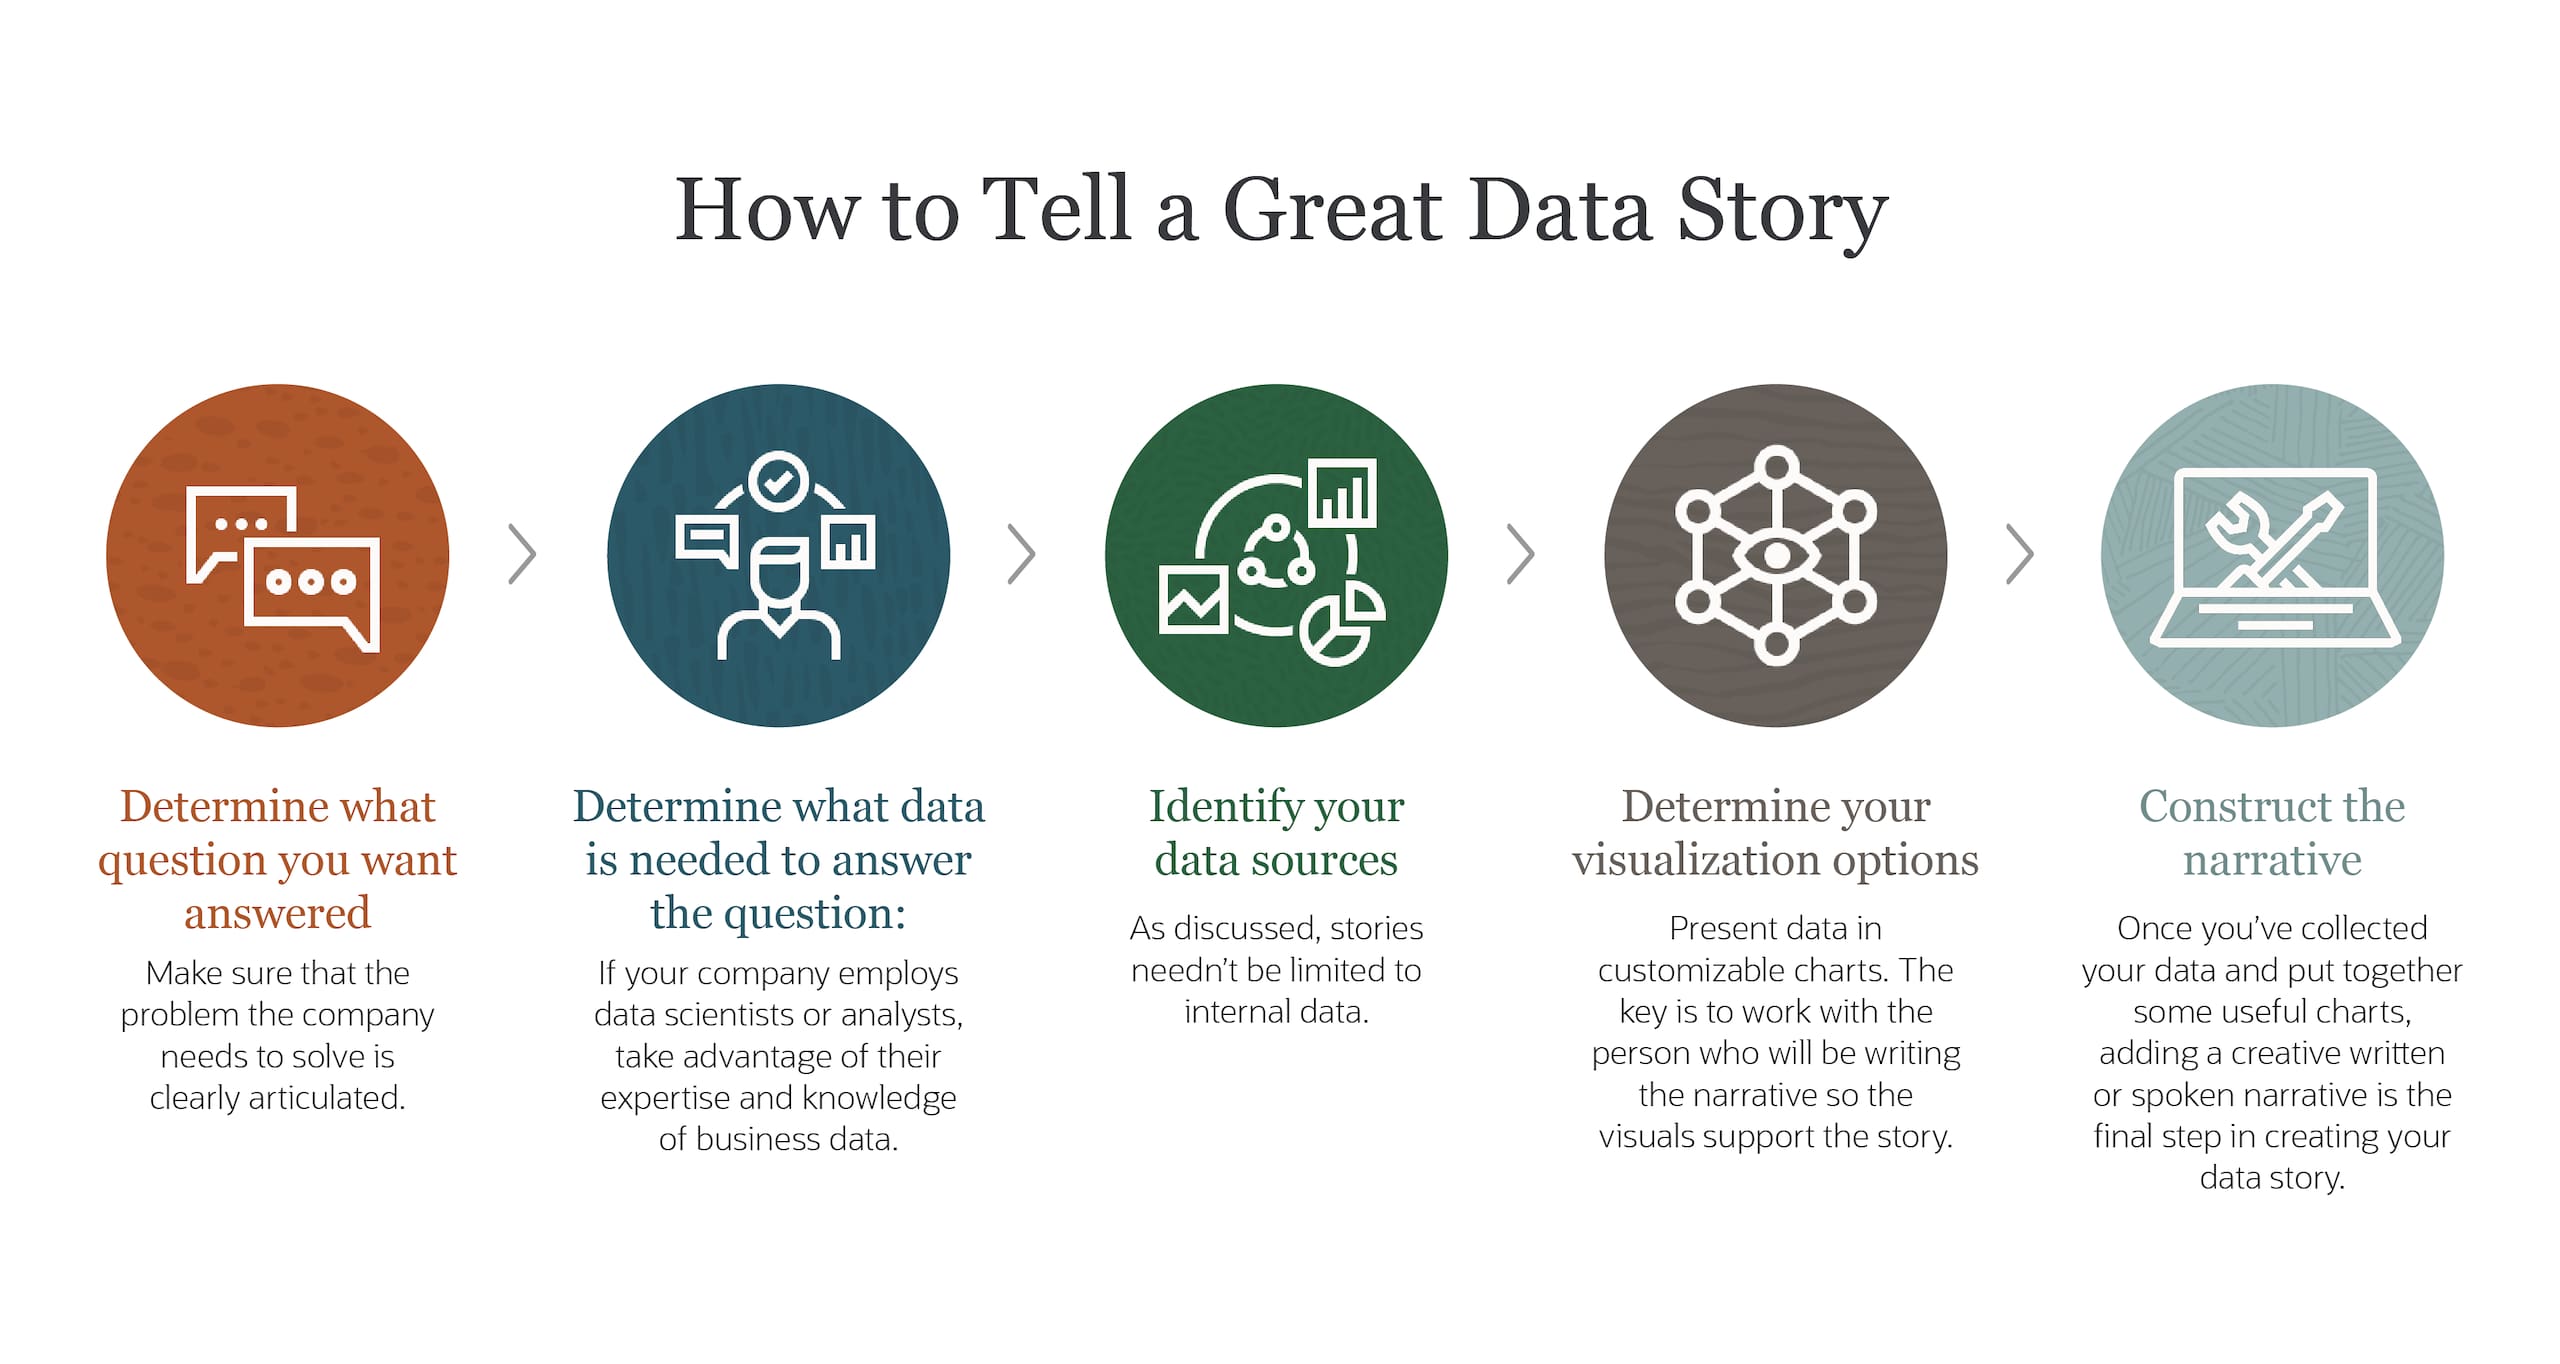
Imagine you’re a detective piecing together clues, or a painter crafting a masterpiece with every brushstroke. That’s the artistry of data storytelling. It’s not just about numbers and charts; it’s about transforming cold facts into a compelling narrative that resonates with your audience, leaving them informed, inspired, and ready to act.

Image: www.netsuite.com
In a world flooded with data, it’s easy to get lost in the numbers. But when you learn to tell a data story, you turn information into a powerful tool that can drive decisions, change opinions, and ultimately, make a real difference. This guide will equip you with the knowledge and techniques to craft compelling data stories that captivate, inform, and inspire.
The Building Blocks of a Data Story
To tell a story, you need a plot, characters, and a message. With data storytelling, these elements take on a new shape:
Data: Your raw materials – the numbers, statistics, facts, and insights you’ll use to build your narrative.
Insights: The conclusions you draw from your data, the questions it answers, and the patterns it reveals.
Context: The background information, industry trends, and historical context that help your audience understand the significance of your story.
Audience: Who are you telling this story to? What are their needs and interests? Understanding your audience helps you tailor your story to their specific needs.
Purpose: What do you want your audience to understand, feel, or do after hearing your story? Is it to educate, persuade, inspire, or motivate them to take action?
The Art of Crafting a Compelling Narrative
A compelling data story does more than just present facts; it weaves them into a captivating narrative that resonates with your audience, leaving them wanting more.
Start with a Hook: Grab your audience’s attention right from the start. Use a surprising statistic, a captivating anecdote, or a provocative question that sets the stage for your story.
Establish the Problem: Clearly define the problem or the situation your story addresses. What challenges or opportunities are you exploring?
Introduce the Data: Present your data in a clear and engaging way. Use charts, graphs, and visuals to illustrate your insights and make your story come alive. But remember, visuals are meant to enhance, not replace, the narrative.
Emphasize the Human Connection: Data should never feel like a cold, detached entity. Connect your story to people’s lives, emotions, and experiences.
Build a Story Arc: Structure your story with a clear beginning, middle, and end. Highlight the key points, build suspense, and guide your audience through your narrative journey.
Deliver a Clear Call to Action: Leave your audience with a sense of purpose and a desire to take action. Tell them what you want them to do, whether it’s to learn more, change their behavior, or support a cause.
Beyond Numbers: Embracing the Power of Visuals
Visuals play a critical role in data storytelling. They can transform complex information into easily digestible insights, making your story more engaging and impactful.
Choose the Right Visuals: Select visuals that align with your data and your message. Don’t simply force visuals into your story; let them organically enhance your narrative.
Tell a Story with Visuals: Visuals are more than just pretty pictures. Use them to illustrate trends, highlight anomalies, and draw comparisons.
Don’t Overload: Keep your visuals clean, simple, and informative. Avoid clutter and make sure they complement, not distract from, your narrative.
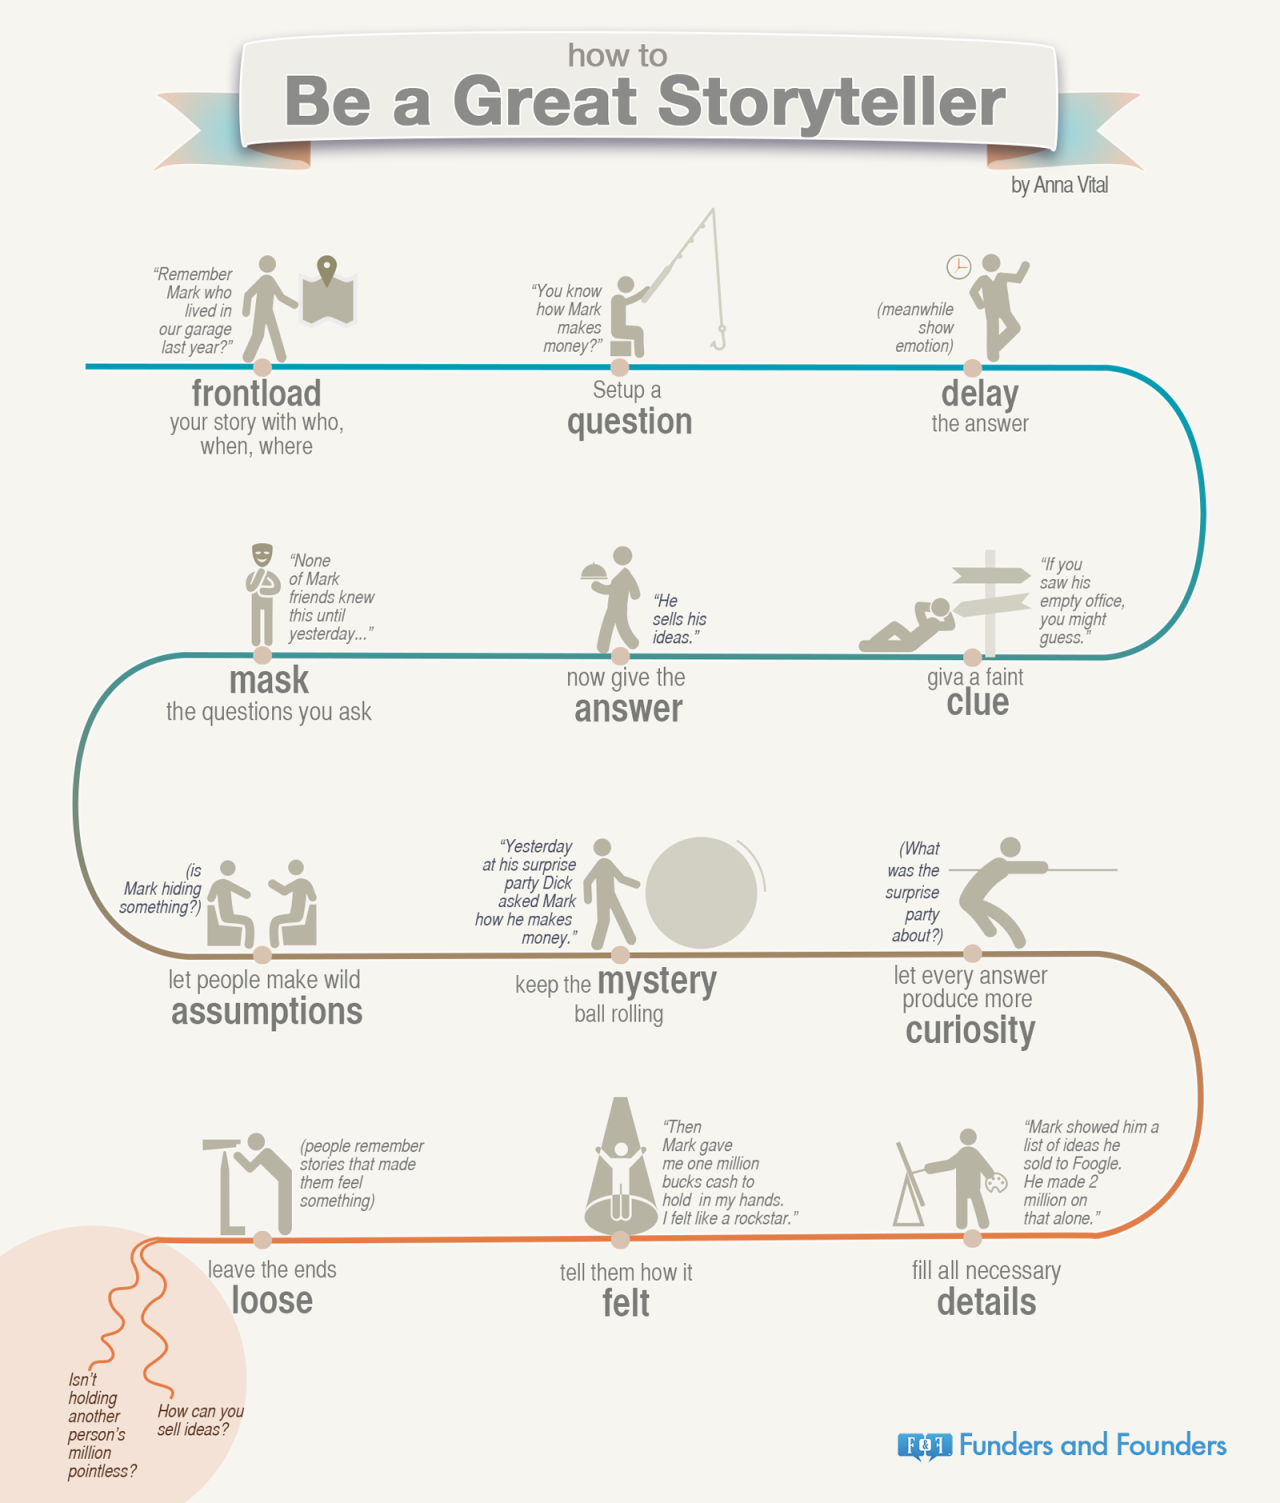
The Power of Infographics: Infographics can effectively combine text, images, and data to create visually appealing and informative stories. Their ability to present complex data in a concise and engaging way makes them a powerful tool for data storytelling.

Image: www.iliyanastareva.com
Real-World Examples: Stories That Make a Difference
Data storytelling is not a theoretical concept; it’s a powerful tool that’s being used every day to drive change and inform decisions.
Public Health: Data stories are used to raise awareness about public health issues, track progress in disease prevention, and advocate for better healthcare policies.
Social Impact: Non-profit organizations use data storytelling to highlight human stories and inspire action around social issues like poverty, inequality, and climate change.
Business: Businesses use data stories to understand their customers, track their sales performance, and make informed decisions that drive growth.
Tools and Resources to Fuel Your Data Storytelling Journey
With the right tools and resources, you can unlock the full potential of data storytelling.
Data Visualization Tools: Tools like Tableau, Power BI, and Data Studio offer visual interfaces that make it easy to create charts, dashboards, and interactive visualizations.
Storytelling Platforms: Platforms like Prezi, Slideshare, and Canva provide templates and features specifically designed for crafting compelling data stories.
Online Courses and Workshops: There are numerous online courses and workshops that teach data storytelling principles, techniques, and best practices.
Project Guide – Tell A Data Story
Bringing Your Data Story to Life
Every great data story begins with a question: What story do you want to tell? Once you find the story within your data, the rest falls into place. And remember, data storytelling is a journey, not a destination. Experiment, learn, and most importantly, have fun! You’ll discover the power of data storytelling to inform, inspire, and ultimately make a difference in the world.


